*** Please note the analysis below is not investment advice. The views and opinions expressed here are solely those of the author and do not necessarily reflect the views of U.Today. Every investment and trading move involves risk, you should conduct your own research when making a decision.
Bitcoin shows massive bullish momentum
Last week, Bitcoin made a pretty ugly downwards breakout and it cracks almost all important supports around $6,250–$6,500. The support level at $6,250 worked nicely and stopped the price movement. Over the weekend, it started slowly rising upwards and it allows us to draw the continuation pattern “Rising Wedge”. But as usual, patterns have opportunities to make a breakout to either direction and currently, BTC is making a super-strong breakout upwards.
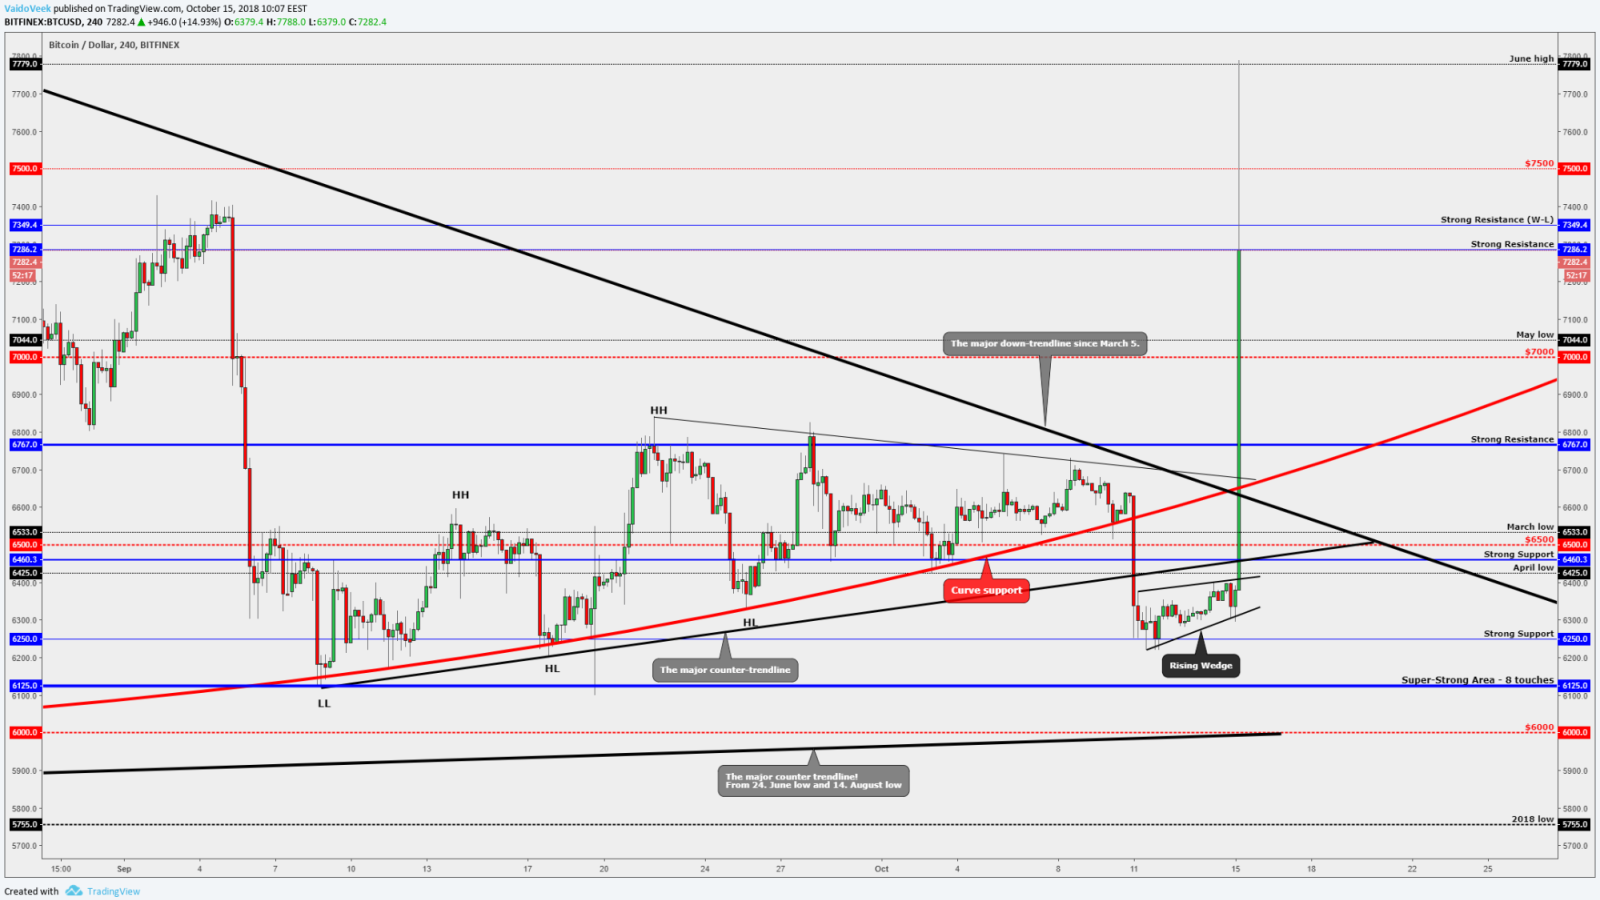
After the massive push, the price breaks the first strong crossing area which consists of the major counter trendline since Sept. 9 and the strong resistance area at $6,460. Altcoins are supporting this move upwards and are also high on the plus side.
It looks like we have found a very strong volume and a very strong buying power from the bulls. Those levels which have worked historically as a very strong support and resistances were just a ‘piece of cake’. The second and the major crossing area consists of the major down-trendline, pulled from March 5, the curve support and the smaller trendline since Sept. 22.
If the price manages to close above the second crossing area, then we will definitely see a bullish week from Bitcoin and despite that — a bullish week for the whole market.
A close above the mentioned area confirms several bullish price action criteria:
- We have a breakout from the round number area at $6,500 which is a guideline as a trend indication.
- We have a breakout from the short-term counter trendline since Sept. 22. It has worked nicely as a resistance and if we get a close above the mentioned level it would be a bullish sign.
- We have a break above the curve support which currently worked as a resistance.
- We have a close above the major down-trendline: it shows that the market has a breakout from the downtrend and it needs to be confirmed with new higher high at around $7,400.
- As we’ve written, currently the price has made a breakout from the key resistance level at $6,767, which will definitely show us bullish power and it has reached into the other round number areas which are $7,000 and $7,500.
This move shows that the bulls are finally on the market and they make big moves. Currently, we could consolidate (sideways movement) between the $6,767 and $7,000; however, it is hard to say where they want to bring the price but this is definitely a strong statement to be bullish this week.
Ripple is one of the top gainers
Today, Ripple peaked just a little bit over 25 percent in the profit. The bounce came: from the round number area at $0.4, from the golden Fibonacci level at 62 percent, from the short-term counter trendline retest area and obviously, the strong BTC movement supports this massive move upwards.
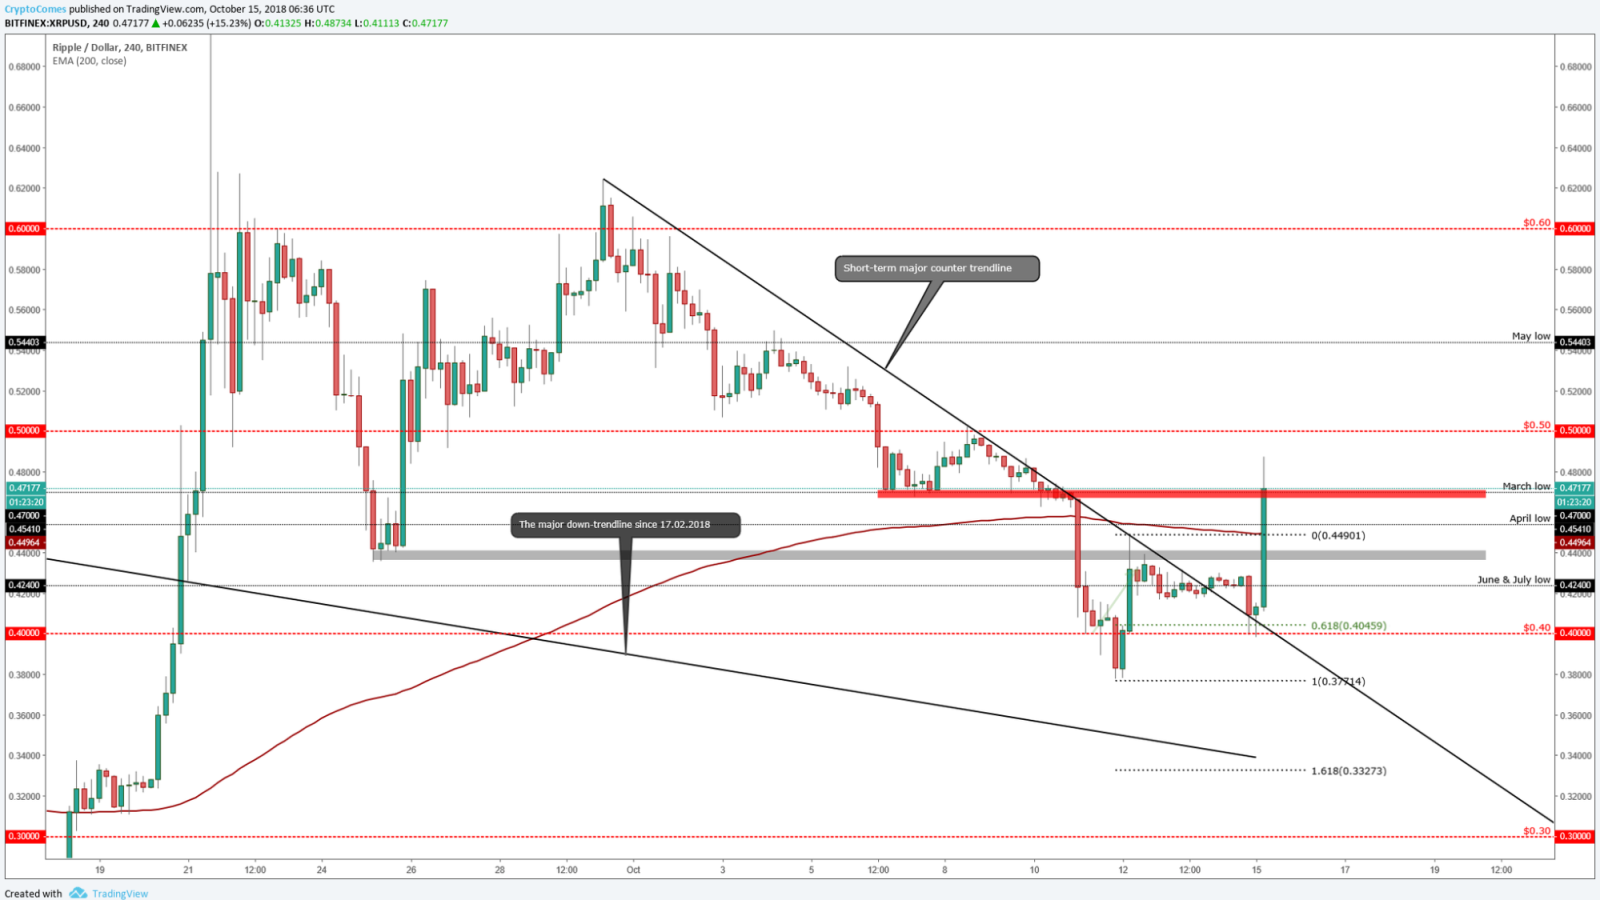
Currently, it trades above the 200 EMA and it has founded a resistance from the previous support level, the March low level at $0.47 which now works as a resistance. Ripple is consolidating at this price level but the move upwards (led by BTC) was a serious statement for the whole market and for the upcoming week.
If the price manages to push through from the mentioned resistance level, the next one is the round number $0.5. To get LIVE updates please visit our TradingView page, there you can get constant updates.
Ethereum (ETH/USD) is ready to make new higher highs
After the strong push the whole markets got, Ethereum has found a resistance from the short-term counter trendline, from the 200 EMA crossing area and from the first strong area at $225.
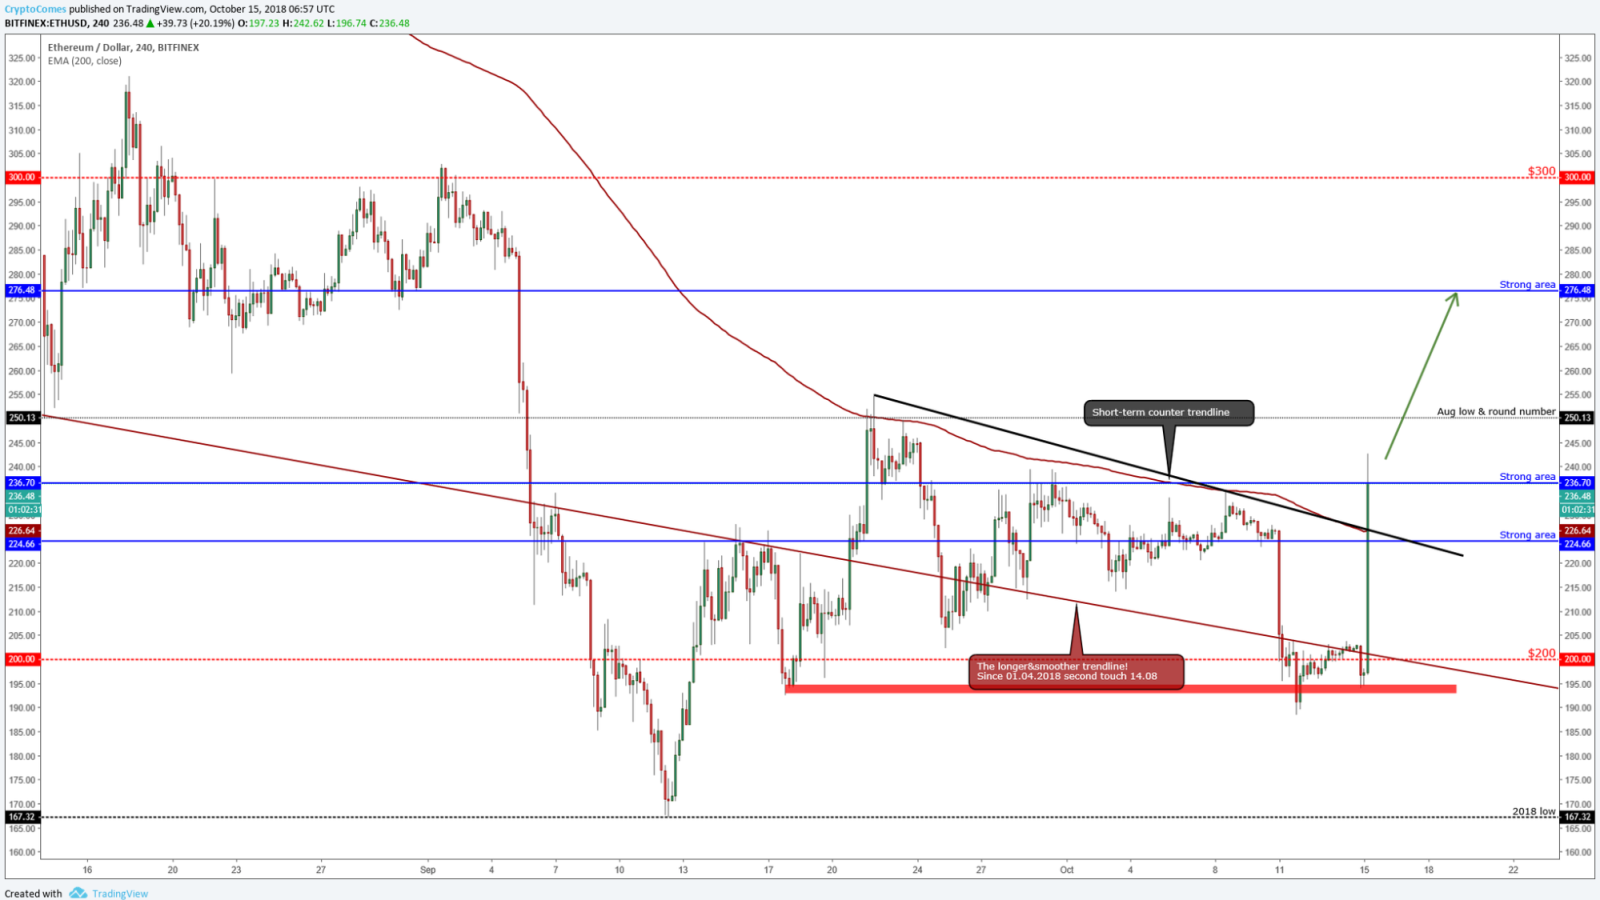
The price has stopped at these levels and is waiting for another pump upwards to push through mentioned levels to confirm another bullish leg upwards. The bounce came from the round number at $200 and our well-known ‘longer & smoother’ trendline since April 1.
If we get a close above the second strong resistance (the blue line) at $236, then we have a fully confirmed breakout and we have made a short-term new higher high and probably the next resistance would be around $275.
The whole market is currently high volatile, but those must be your first guidelines to confirm your higher levels viewpoints.